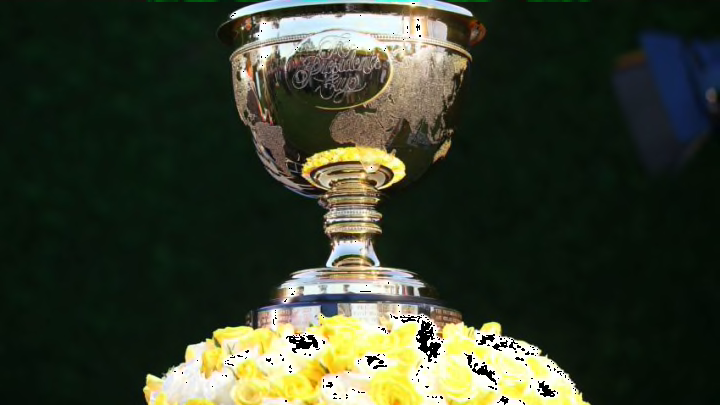
Looking deep into the data of how the American and International teams for the Presidents Cup, and how they stack up for Royal Melbourne.
When Presidents Cup play begins at Royal Melbourne, virtually all of the expert consensus favors the U.S. team.
Eight of the top 15 players in the Official World Golf Rankings will line up on the American side. The International team has none. The average rank of the dozen American team members is 12.25; the average rank of the Internationals is 40.5.
Led by their captain Tiger Woods, the U.S. team can boast of a collective 19 major championships, two as recently as last year: Woods’ Masters win and Gary Woodland’s U.S. Open title. The Internationals have a combined two majors, none since Adam Scott’s Masters championship in 2013.
Beyond that, the American team is simply playing better. The American team posted a 69.89 stroke average last season, more than a half stroke better than the International team’s 70.44 stroke average. Only two of the Internationals – Scott and Hideki Matsuyama – turned in average scores below 70; eight Americans did so.
As a package, it sounds like a Yankee walkover in Melbourne. Still, it would be a very good idea to look at the data before jumping to a conclusion. There is an abundance of comparative data available since all but two of the 24 players – Woods and the Internationals’ Haotong Li – played enough rounds last season to develop a full data profile using the highly accurate Strokes Gained system.
We can assess the strengths and weaknesses of each team using that Strokes Gained data on three levels. The first is simply the average Strokes Gained performance, the second is the ordinal rank of each team member in each skill, and the third is the standard deviation of each team member’s performance at each skill.
The third category is important because while an ordinal rank will tell us who led the category and who finished 10, it will not reveal the degree of each player’s dominance, as will standard deviation.
